Market Outlook
November 10, 2017
Market Cues
Domestic Indices
Chg (%)
(Pts)
(Close)
Indian markets are likely to open negative tracking global indices and SGX Nifty.
BSE Sensex
0.1
32
33,251
Nifty
0.1
6
10,309
The US markets climbed off their worst levels of the day but still ended Thursday's
trading firmly in negative territory. With the drop on the day, the major US averages
Mid Cap
1.0
161
16,578
pulled back off the record closing highs set in the previous session. The Dow fell 0.4
Small Cap
0.8
133
17,631
percent to 23,462, the Nasdaq slid 0.6 percent to 6,750 and the S&P 500 dropped
Bankex
0.5
152
28,635
0.4 percent to 2,585. The weakness on Wall Street came as traders reacted to
reports regarding the Senate version of tax reform legislation.
Global Indices
Chg (%)
(Pts)
(Close)
The UK shares were subdued on Thursday as US tax reform worries and simmering
Dow Jones
(0.4)
(101)
23,462
Middle East tensions kept traders on tenterhooks. Also, Brexit negotiations are set to
Nasdaq
(0.6)
(39)
6,750
resume in Brussels today as the European Union and Britain seek to move forward
FTSE
(0.6)
(46)
7,484
on several key issues. The benchmark FTSE 100 closed at 7484, down 0.6 percent.
Nikkei
(0.2)
(45)
22,869
Indian shares ended Thursday's session marginally higher after suffering heavy
Hang Seng
0.8
229
29,137
losses in the previous two sessions. While U.S. tax reform worries and simmering
Shanghai Com
0.4
12
3,428
Middle East tensions kept traders on tenterhooks, bargain hunting ahead of a goods
and service tax (GST) council meeting helped stocks finish on a positive note. The
Advances / Declines
BSE
NSE
benchmark BSE Sensex ended a choppy session up 0.10 percent at 33,251 while the
Advances
1,469
976
broader Nifty index finished at 10,309, up 0.06 percent from its previous close.
Declines
1,264
748
News Analysis
Unchanged
144
73
Zydus Cadila, Intas under scanner for launching hypertension drug without
permit
Volumes (` Cr)
Detailed analysis on Pg2
BSE
4,516
NSE
33,372
Investor’s Ready Reckoner
Key Domestic & Global Indicators
Net Inflows (` Cr)
Net
Mtd
Ytd
Stock Watch: Latest investment recommendations on 150+ stocks
FII
679
4,445
42,897
Refer Pg5 onwards
MFs
(138)
(138)
95,272
Top Picks
CMP
Target
Upside
Company
Sector
Rating
Top Gainers
Price (`)
Chg (%)
(`)
(`)
(%)
Blue Star
Capital Goods
Buy
674
867
28.6
Rtnpower
7
19.9
Dewan Housing Finance
Financials
Accumulate
633
712
12.5
Pageind
22,314
8.4
Asian Granito
Other
Buy
494
570
15.4
Indianb
400
8.2
Navkar Corporation
Other
Buy
189
265
40.1
Amarajabat
735
7.7
KEI Industries
Capital Goods Accumulate
344
380
10.6
More Top Picks on Pg4
Tataglobal
240
7.0
Key Upcoming Events
Top Losers
Price (`)
Chg (%)
Previous
Consensus
Date
Region
Event Description
Reading
Expectations
Gsfc
142
(6.0)
Nov10
India
Industrial Production YoY
4.30
3.80
Mgl
1,160
(5.3)
Nov10
UK
Industrial Production (YoY)
1.60
1.90
Rcom
15
(3.9)
Nov13
India
Imports YoY%
18.09
Chennpetro
445
(3.8)
Nov13
China
Industrial Production (YoY)
6.60
6.30
Nov14
India
Exports YoY%
25.67
Cadilahc
479
(3.7)
More Events on Pg7
As on November, 09 2017
Market Outlook
November 10, 2017
News Analysis
Zydus Cadila, Intas under scanner for launching hypertension
drug without permit
Zydus Cadila and Intas are under the regulatory scanner for allegedly launching a
combination drug to treat hypertension without mandatory prior approval. The
Central Drug Standards Control Organization (CDSCO) has initiated an inquiry
against Zydus Cadila and Intas Pharmaceuticals after receiving a complaint from
Hyderabad based company, Hetero Drugs which is conducting clinic trials for the
launch of the same project.
A drug maker needs to take a prior approval from the Drug Controller General of
India (DCGI) before launching any product. As per CDSCO guidelines, if the
product is approved elsewhere and not in India, Phase III clinical trials and bio-
equivalence studies are required to establish its safety and efficacy on the Indian
population.
Hyderabad-based Hetero Drugs had in December
2015 applied for
manufacturing and marketing approval for this combination drug which was
advised by the regulator to conduct bio-equivalence and clinical trials in July
2017. The company completed the bio-equivalence study and submitted its report
to the DCGI in September 2017. While the trials were still on, it was found that the
combination drug is already available in the market which led to a this inquiry.
Hetero Drugs has alleged that the product had been launched without mandatory
trials being conducted.
Economic and Political News
Oil Morphs From Modi’s Blessing to Burden That Threatens Economy
Global Funds Cut Indian, Indonesian Bonds, Buy Thailand Debt
RBI Sells 100b Rupees of Bonds Via Open-Market Operation
India Sell-Off in Bonds May Reverse as Inflation Slows
India's Industrial Output Growth May Have Picked Up in September
Corporate News
Jaguar Helps Parent Post Biggest Profit Jump in Six Quarters
Reliance May Buy Polyester Unit of Alok Industries
Jewelers Say They Haven’t Smiled Since India Cash Ban a Year Ago
India’s Iron Ore Output Seen About 210M Tons This Fiscal: NMDC
Market Outlook
November 10, 2017
Quarterly Bloomberg Brokers Consensus Estimate
DLF Ltd - Nov 10, 2017
Particulars ( ` cr)
2QFY18E
2QFY17
y-o-y (%)
1QFY18
q-o-q (%)
Sales
2,072
2,070
0.1
2,047
1.3
EBIDTA
899
1,020
(11.9)
903
(0.5)
%
43.3
49.3
44.1
PAT
79
206
(61.6)
109
(27.6)
BPCL Ltd - Nov 10, 2017
Particulars ( ` cr)
2QFY18E
2QFY17
y-o-y (%)
1QFY18
q-o-q (%)
Sales
59,286
44,692
32.6
57,125
3.8
EBIDTA
3,767
1,381
172
1,225
207
%
6.4
3.1
2.2
PAT
2,868
1,305
119
744
285
M&M Ltd - Nov 10, 2017
Particulars ( ` cr)
2QFY18E
2QFY17
y-o-y (%)
1QFY18
q-o-q (%)
Sales
12,358
10,609
16.5
11,575
6.8
EBIDTA
1,624
1,237
31.3
1,266
28.3
%
13.2
11.7
10.9
PAT
1,118
1,163
(3.9)
765
46.2
Motherson Sumi Ltd - Nov 10, 2017
Particulars ( ` cr)
2QFY18E
2QFY17
y-o-y (%)
1QFY18
q-o-q (%)
Sales
13,418
10,136
32.4
13,128
2.3
EBIDTA
1,317
1,006
30.9
1,036
27.2
%
9.8
9.9
7.9
PAT
501
479
4.6
347
44.4
Bosch Ltd - Nov 10, 2017
Particulars ( ` cr)
2QFY18E
2QFY17
y-o-y (%)
1QFY18
q-o-q (%)
Sales
3,128
2,611
19.8
2,648
18.1
EBIDTA
581
469
23.9
439
32.4
%
18.6
17.9
16.5
PAT
437
703
(37.8)
302
44.7
State Bank Of India - Nov 10, 2017
Particulars ( `cr)
2QFY18E
2QFY17
y-o-y (%)
1QFY18
q-o-q (%)
PAT
2,759
2,538
8.7
2,005
37.6
MRF Ltd. - Nov 10, 2017
Particulars ( `cr)
2QFY18E
2QFY17
y-o-y (%)
1QFY18
q-o-q (%)
PAT
311
385
(19.3)
106
193
Market Outlook
November 10, 2017
Top Picks HHHHH
Market Cap
CMP
Target
Upside
Company
Rationale
(` Cr)
(`)
(`)
(%)
Strong growth in domestic business due to its leade`hip
in acute therapeutic segment. Alkem expects to launch
Alkem Laboratories
23,233
1,943
2,125
9.4
more products in USA, which bodes for its international
business.
We expect the company would report strong profitability
Asian Granito
1,486
494
570
15.4
owing to better product mix, higher B2C sales and
amalgamation synergy.
Favorable outlook for the AC industry to augur well for
Cooling products business which is out pacing the
Blue Star
6,461
674
867
28.6
market growth. EMPPAC division's profitability to
improve once operating environment turns around.
With a focus on the low and medium income (LMI)
consumer segment, the company has increased its
Dewan Housing Finance
19,851
633
712
12.5
presence in tier-II & III cities where the growth
opportunity is immense.
Loan growth is likely to pick up after a sluggish FY17.
Lower credit cost will help in strong bottom-line growth.
Karur Vysya Bank
7,551
125
180
44.1
Increasing share of CASA will help in NIM
improvement.
High order book execution in EPC segment, rising B2C
KEI Industries
2,692
344
380
10.6
sales and higher exports to boost the revenues and
profitability
Expected to benefit from the lower capex requirement
Music Broadcast
2,150
377
434
15.2
and 15 year long radio broadcast licensing.
Massive capacity expansion along with rail advantage
Navkar Corporation
2,697
189
265
40.1
at ICD as well CFS augur well for the company
Strong brands and distribution network would boost
Siyaram Silk Mills
2,809
599
650
8.5
growth going ahead. Stock currently trades at an
inexpensive valuation.
Market leadership in Hindi news genre and no.
2
viewership ranking in English news genre, exit from the
TV Today Network
2,198
369
435
18.0
radio business, and anticipated growth in ad spends by
corporate to benefit the stock.
After GST, the company is expected to see higher
volumes along with improving product mix. The Gujarat
Maruti Suzuki
2,47,765
8,202
8,890
8.4
plant will also enable higher operating leverage which
will be margin accretive.
We expect loan book to grow at 24.3% over next two
GIC Housing
2,368
440
655
49.0
year; change in borrowing mix will help in NIM
improvement..
Source: Company, Angel Research
Market Outlook
November 10, 2017
Key Upcoming Events
Result Calendar
Date
Company
November 10, 2017
M&M, Bosch India, Motherson Sumi, Suzlon Energy, St Bk of India, Bank of India, Allahabad Bank, MRF, HSIL, DLF
November 11, 2017
Mangalam Cement, Coal India, Nalco, Godawari Ispat, Siyaram Silk Mills
Source: Bloomberg, Angel Research
Global economic events release calendar
Bloomberg Data
Date
Time
Country
Event Description
Unit
Period
Last Reported
Estimated
Nov 10, 2017
5:30 PMIndia
Industrial Production YoY
% Change
Sep
4.30
3.80
3:00 PMUK
Industrial Production (YoY)
% Change
Sep
1.60
1.90
Nov 13, 2017
India
Imports YoY%
% Change
Oct
18.09
7:30 AMChina
Industrial Production (YoY)
% Change
Oct
6.60
6.30
Nov 14, 2017
India
Exports YoY%
% Change
Oct
25.67
3:30 PMEuro Zone Euro-Zone GDP s.a. (QoQ)
% Change
3Q P
0.60
3:00 PMUK
CPI (YoY)
% Change
Oct
3.00
3.20
12:00 PMIndia
Monthly Wholesale Prices YoY%
% Change
Oct
2.60
3.01
US
Producer Price Index (mom)
% Change
Oct
0.80
12:30 PMGermany GDP nsa (YoY)
% Change
3Q P
0.80
Nov 15, 2017
3:00 PMUK
Jobless claims change
% Change
Oct
1.70
7:00 PMUS
Consumer price index (mom)
% Change
Oct
0.50
0.10
Nov 16, 2017
3:30 PMEuro Zone Euro-Zone CPI (YoY)
%
Oct F
1.40
7:45 PMUS
Industrial Production
%
Oct
0.28
0.50
Nov 17, 2017
7:00 PMUS
Housing Starts
Thousands
Oct
1,127.00
1,183.00
Source: Bloomberg, Angel Research
Market Outlook
November 10, 2017
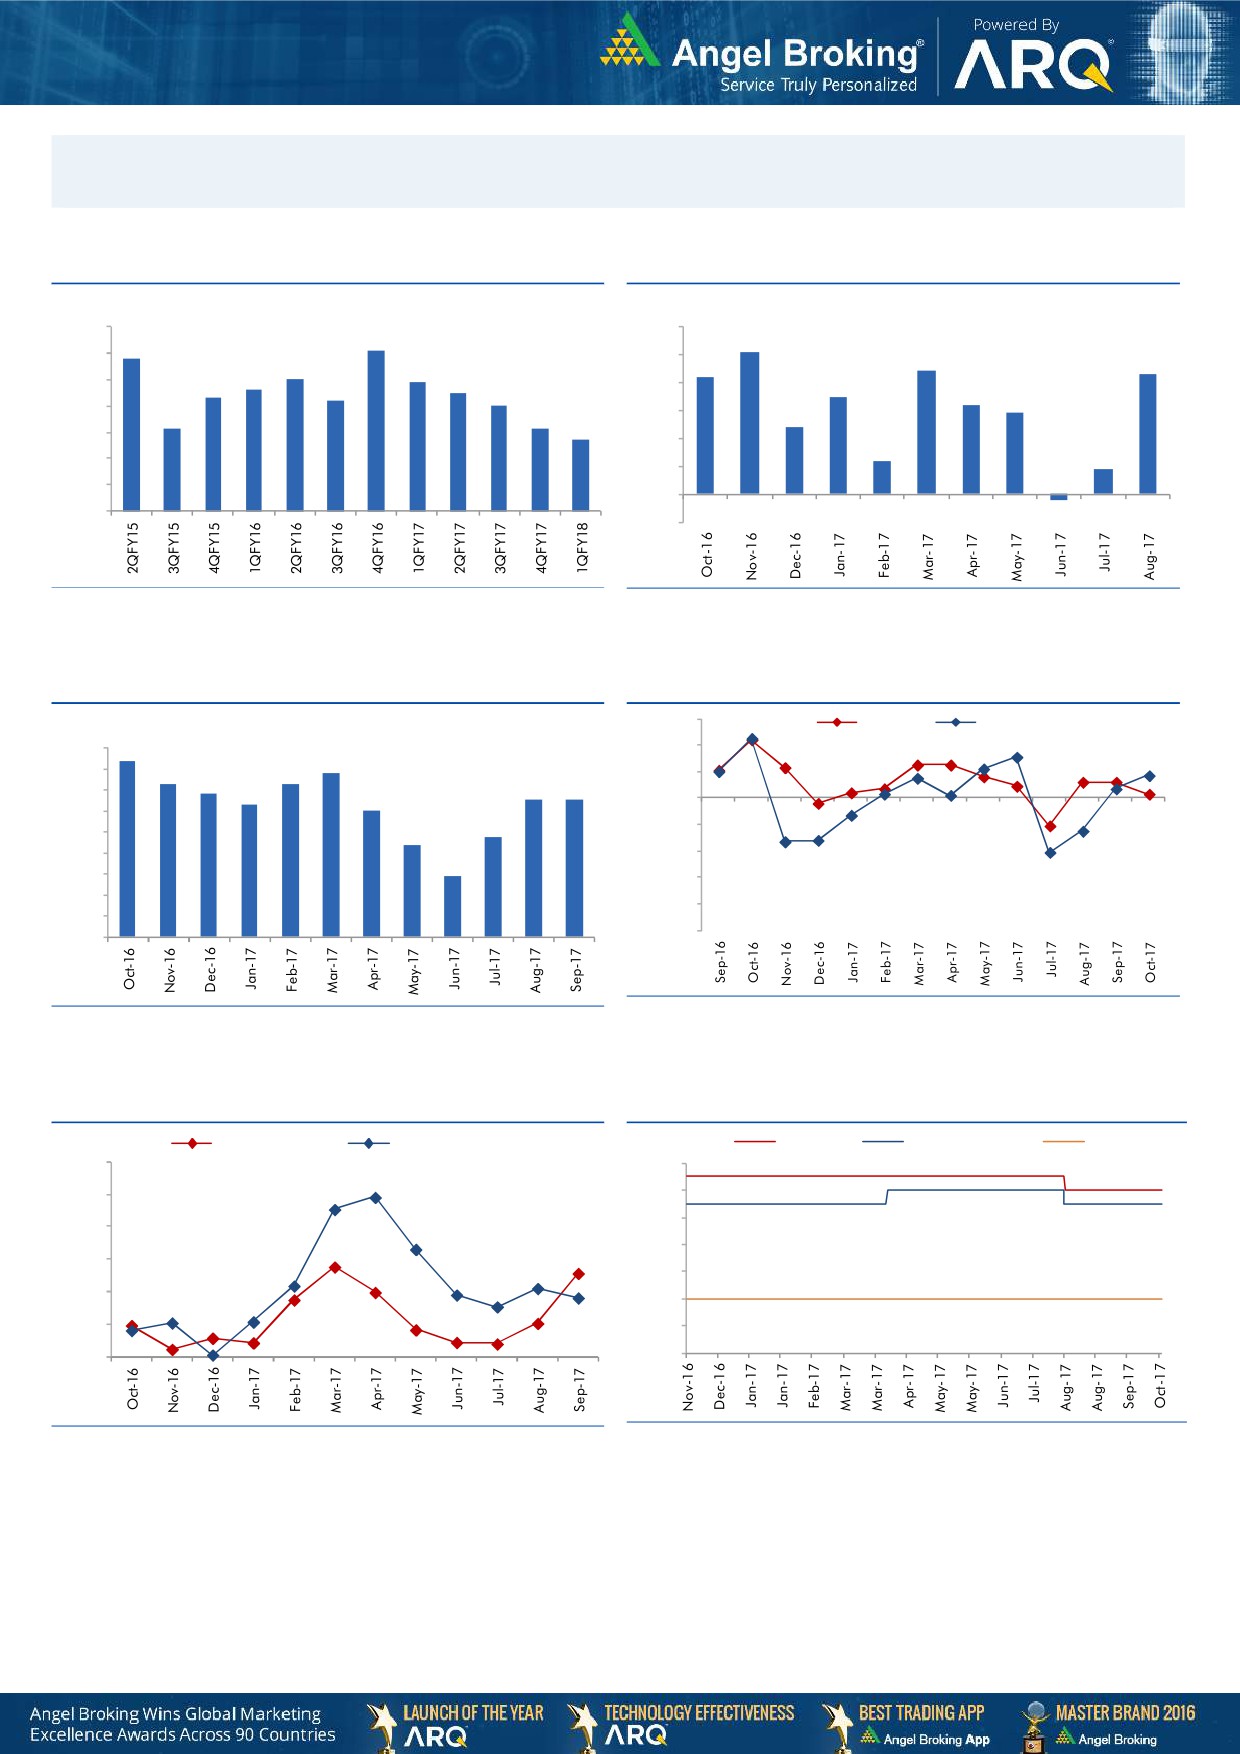
Macro watch
Exhibit 1: Quarterly GDP trends
Exhibit 2: IIP trends
(%)
(%)
10.0
6.0
9.1
5.1
8.8
9.0
5.0
4.4
4.3
8.0
7.9
4.2
7.6
7.5
8.0
7.3
7.2
4.0
3.5
7.0
3.2
2.9
7.0
6.1
6.1
3.0
2.4
5.7
6.0
2.0
1.2
0.9
5.0
1.0
4.0
-
3.0
(1.0)
(0.2)
Source: CSO, Angel Research
Source: MOSPI, Angel Research
Exhibit 3: Monthly CPI inflation trends
Exhibit 4: Manufacturing and services PMI
56.0
Mfg. PMI
Services PMI
(%)
4.5
4.2
54.0
3.9
4.0
3.6
3.7
52.0
3.4
3.3
3.3
3.5
3.2
3.0
50.0
3.0
2.2
2.4
48.0
2.5
2.0
46.0
1.5
1.5
44.0
1.0
42.0
0.5
40.0
-
Source: Market, Angel Research; Note: Level above 50 indicates expansion
Source: MOSPI, Angel Research
Exhibit 5: Exports and imports growth trends
Exhibit 6: Key policy rates
(%)
Exports yoy growth
Imports yoy growth
(%)
Repo rate
Reverse Repo rate
CRR
60.0
6.50
50.0
6.00
5.50
40.0
5.00
30.0
4.50
20.0
4.00
10.0
3.50
0.0
3.00
Source: Bloomberg, Angel Research
Source: RBI, Angel Research
Market Outlook
November 10, 2017
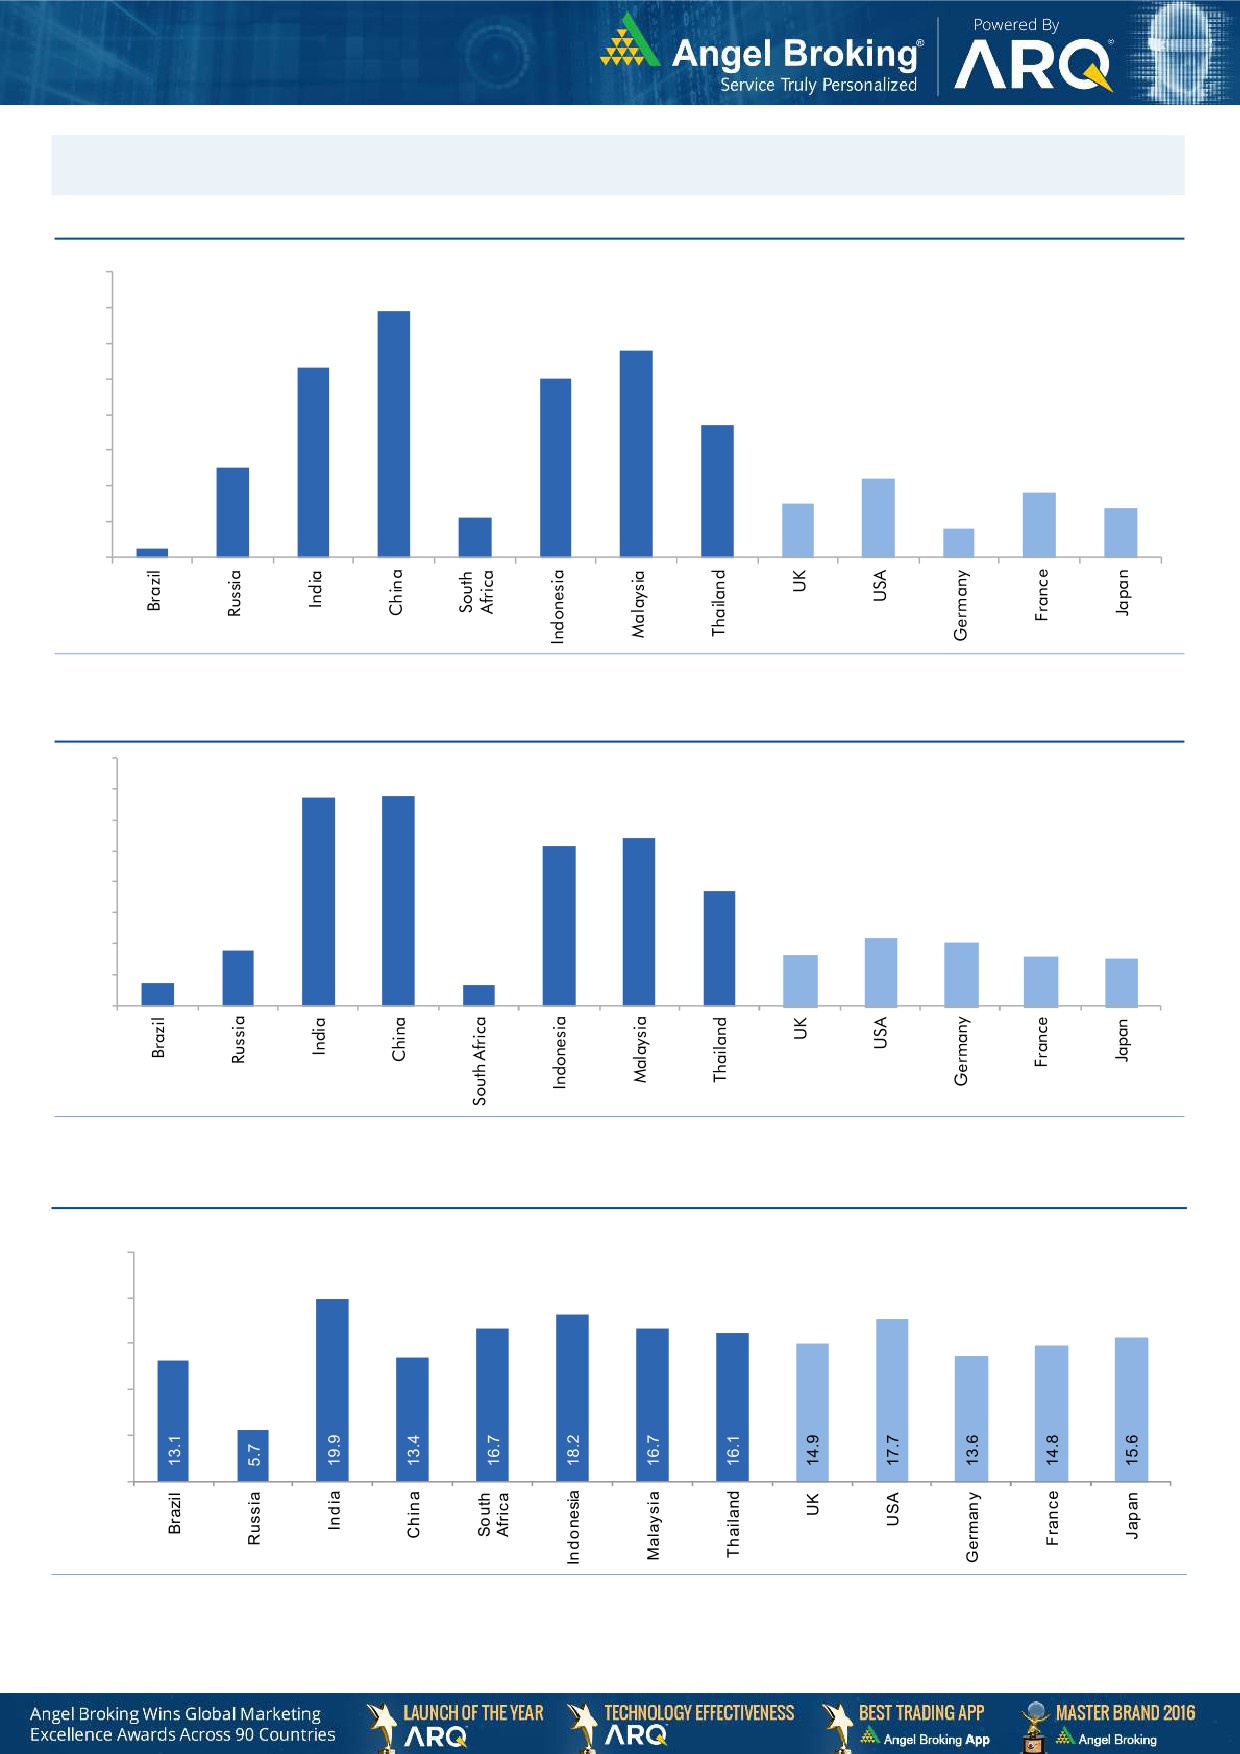
Global watch
Exhibit 1: Latest quarterly GDP Growth (%, yoy) across select developing and developed countries
(%)
8.0
6.9
7.0
5.8
6.0
5.3
5.0
5.0
1.1
3.7
4.0
2.5
3.0
2.2
1.8
2.0
1.5
1.4
0.8
1.0
0.3
-
Source: Bloomberg, Angel Research
Exhibit 2: 2017 GDP Growth projection by IMF (%, yoy) across select developing and developed countries
(%)
6.7
6.8
7.0
6.0
5.4
5.2
5.0
3.7
4.0
3.0
1.8
2.2
2.0
1.7
1.6
2.0
0.7
1.5
0.7
1.0
-
Source: IMF, Angel Research
Exhibit 3: One year forward P-E ratio across select developing and developed countries
(x)
25.0
20.0
15.0
10.0
5.0
-
Source: IMF, Angel Research
Market Outlook
November 10, 2017
Exhibit 4: Relative performance of indices across globe
Returns (%)
Country
Name of index
Closing price
1M
3M
1YR
Brazil
Bovespa
72,931
(4.1)
7.4
13.9
Russia
Micex
2,184
4.2
11.4
7.5
India
Nifty
10,309
3.2
2.5
21.3
China
Shanghai Composite
3,428
1.0
4.3
10.3
South Africa
Top 40
53,514
4.2
8.5
22.1
Mexico
Mexbol
48,714
(2.7)
(4.3)
8.3
Indonesia
LQ45
1,005
3.0
3.9
9.1
Malaysia
KLCI
1,747
(1.0)
(1.6)
4.5
Thailand
SET 50
1,082
0.3
8.2
14.7
USA
Dow Jones
23,462
2.8
7.4
24.7
UK
FTSE
7,484
(0.7)
1.3
11.2
Japan
Nikkei
22,869
10.5
14.0
33.5
Germany
DAX
13,183
1.6
8.5
23.3
France
CAC
5,408
0.8
6.9
19.4
Source: Bloomberg, Angel Research p68in4
Stock Watch
November 10, 2017
Company Name
Reco
CMP
Target
Mkt Cap
Sales ( Čcr )
OPM(%)
EPS (Č)
PER(x)
P/BV(x)
RoE(%)
EV/Sales(x)
(Č)
Price ( Č)
( Č cr )
FY18E FY19E
FY18E
FY19E
FY18E
FY19E
FY18E
FY19E
FY18E
FY19E
FY18E
FY19E
FY18E
FY19E
Agri / Agri Chemical
Rallis
Reduce
226
209
4,402
1,873
2,099
15.0
15.0
9.5
10.5
23.8
21.6
3.6
3.3
15.8
16.0
2.2
2.0
United Phosphorus
Accumulate
746
820
37,921
18,922
21,949
18.0
18.5
36.2
45.6
20.6
16.4
4.3
3.6
22.7
23.8
2.2
1.8
Auto & Auto Ancillary
Ashok Leyland
Accumulate
115
127
33,779
23,339
27,240
10.1
10.8
4.7
6.2
24.8
18.6
5.0
4.4
20.0
23.6
1.4
1.2
Bajaj Auto
Neutral
3,200
-
92,596
23,936
27,955
19.5
20.1
142.7
167.3
22.4
19.1
4.9
4.4
21.8
22.8
3.5
2.9
Bharat Forge
Buy
719
875
33,471
7,637
8,755
21.7
23.2
36.1
47.3
19.9
15.2
3.6
3.0
18.5
20.8
4.2
3.6
Eicher Motors
Neutral
30,853
-
83,991
19,043
22,837
19.5
19.9
835.4
1,019.0
36.9
30.3
13.8
10.6
40.9
37.8
4.3
3.5
Gabriel India
Neutral
194
-
2,791
1,782
2,033
9.7
10.2
7.1
8.9
27.4
22.0
5.5
4.7
21.0
22.2
1.5
1.3
Hero Motocorp
Accumulate
3,604
4,129
71,970
32,239
36,878
16.0
15.6
184.4
206.5
19.6
17.5
6.1
5.4
31.3
30.7
2.0
1.7
Jamna Auto Industries Neutral
61
-
2,436
1,441
1,662
14.4
14.8
13.9
17.6
4.4
3.5
1.2
1.0
30.0
31.0
1.7
1.4
Mahindra and Mahindra Neutral
1,362
-
84,562
46,971
53,816
13.6
14.0
67.7
79.8
20.1
17.1
2.9
2.6
15.0
15.9
1.7
1.4
Maruti
Accumulate
8,202
8,890
247,765
80,985
97,917
15.6
16.9
282.3
370.4
29.1
22.1
6.3
5.1
21.8
23.1
2.7
2.2
Minda Industries
Neutral
942
-
8,141
4,328
5,084
11.0
11.9
27.3
36.4
34.6
25.9
7.3
5.7
23.1
25.6
2.0
1.7
Motherson Sumi
Neutral
361
-
76,039
55,937
64,445
10.8
11.4
16.9
21.1
21.4
17.2
4.8
4.9
25.2
25.4
1.4
1.2
Tata Motors
Neutral
440
-
127,130
303,167
343,649
11.8
13.8
33.1
54.7
13.3
8.1
2.2
1.7
16.9
23.0
0.5
0.4
TVS Motor
Neutral
695
-
32,995
13,992
16,216
9.0
9.4
17.1
20.3
40.7
34.2
10.8
8.4
29.7
27.7
2.3
1.9
Amara Raja Batteries
Buy
735
858
12,550
6,140
7,122
14.3
15.6
29.3
39.0
25.1
18.8
4.3
3.6
17.1
19.0
2.1
1.8
Exide Industries
Neutral
202
-
17,204
8,689
9,854
15.1
15.2
9.7
11.0
21.0
18.4
3.7
3.3
15.7
16.1
1.7
1.5
Apollo Tyres
Neutral
233
-
11,842
15,739
17,326
13.3
14.6
20.4
26.7
11.4
8.7
1.4
1.2
20.4
26.7
1.0
0.9
Ceat
Neutral
1,713
-
6,927
6,661
7,717
11.1
14.2
116.2
178.2
14.7
9.6
2.6
2.1
15.2
21.3
1.1
1.0
JK Tyres
Neutral
148
-
3,360
8,318
9,239
16.2
16.4
21.0
27.5
7.1
5.4
1.4
1.1
19.1
20.4
0.9
0.7
Swaraj Engines
Neutral
1,912
-
2,375
788
889
16.4
16.5
71.6
81.0
26.7
23.6
7.7
7.2
29.6
31.0
2.7
2.3
Subros
Neutral
251
-
1,504
1,855
2,135
11.6
11.8
10.3
14.7
24.5
17.1
3.7
3.2
15.8
19.1
1.0
0.9
Capital Goods
BEML
Neutral
1,770
-
7,370
4,286
5,194
7.1
8.2
42.9
58.1
41.3
30.5
3.4
3.1
7.6
8.7
1.8
1.4
Bharat Electronics
Neutral
184
-
45,282
10,258
12,470
19.6
19.5
7.3
8.6
25.3
21.4
0.5
0.4
20.4
21.9
3.9
3.2
Voltas
Neutral
562
-
18,599
6,778
8,004
9.6
11.0
17.1
22.4
32.9
25.1
7.8
6.9
17.7
19.8
2.4
2.1
BHEL
Neutral
92
-
33,777
33,200
39,167
6.8
9.5
6.2
11.2
14.8
8.2
0.7
0.7
4.6
8.0
0.6
0.5
Blue Star
Buy
674
867
6,461
5,220
6,207
6.3
6.6
16.8
22.3
40.1
30.3
8.0
7.0
19.9
23.3
1.2
1.0
CG Power and Industrial
Neutral
87
-
5,450
6,555
7,292
7.5
7.5
-
0.8
8,695.0
108.7
1.4
1.4
0.1
1.2
0.9
0.8
Solutions
Greaves Cotton
Neutral
123
-
3,011
1,778
1,993
14.7
15.1
8.1
9.1
15.2
13.6
3.4
3.2
21.8
23.6
1.5
1.3
Stock Watch
November 10, 2017
Company Name
Reco
CMP
Target
Mkt Cap
Sales ( Čcr )
OPM(%)
EPS (Č)
PER(x)
P/BV(x)
RoE(%)
EV/Sales(x)
(Č)
Price ( Č)
( Č cr )
FY18E FY19E
FY18E
FY19E
FY18E
FY19E
FY18E
FY19E
FY18E
FY19E
FY18E
FY19E
FY18E
FY19E
Capital Goods
KEC International
Accumulate
311
350
7,992
9,779
11,113
9.4
9.8
14.2
18.2
21.9
17.1
4.2
3.4
21.1
22.1
1.1
0.9
KEI Industries
Accumulate
344
380
2,692
3,001
3,391
10.0
10.0
13.0
16.1
26.4
21.3
4.8
4.0
18.2
18.7
1.1
0.9
Thermax
Neutral
980
-
11,679
4,125
4,747
10.3
10.8
26.7
31.5
36.7
31.1
4.1
3.8
11.2
12.0
2.6
2.2
VATech Wabag
Buy
583
681
3,183
3,867
4,126
9.6
10.0
34.9
39.8
16.7
14.7
2.8
2.4
17.7
17.5
0.8
0.8
Cement
ACC
Neutral
1,761
-
33,062
12,255
13,350
13.5
14.3
58.0
66.2
30.4
26.6
3.6
3.4
11.5
12.2
2.7
2.4
Ambuja Cements
Neutral
271
-
53,712
10,250
11,450
17.5
19.0
7.2
8.3
37.6
32.6
2.7
2.5
7.0
7.8
5.0
4.4
India Cements
Neutral
174
-
5,362
6,135
6,750
14.8
15.2
8.5
11.5
20.5
15.1
1.0
1.0
4.8
6.2
1.2
1.1
JK Cement
Neutral
1,027
-
7,183
4,150
4,775
19.2
20.0
49.0
63.5
21.0
16.2
3.3
2.9
17.0
18.5
2.2
1.8
J K Lakshmi Cement
Neutral
455
-
5,353
3,422
3,757
15.5
17.0
13.5
23.2
33.7
19.6
3.5
3.0
10.8
15.5
2.0
1.7
Orient Cement
Neutral
169
-
3,459
2,215
3,233
16.8
17.0
5.9
6.9
28.6
24.5
2.2
2.0
10.8
10.1
2.6
1.7
UltraTech Cement
Neutral
4,369
-
119,936
28,250
35,150
20.2
23.5
77.5
122.2
56.4
35.8
4.8
4.3
9.6
14.8
4.7
3.8
Construction
KNR Constructions
Neutral
264
-
3,709
1,846
2,203
14.5
14.5
12.1
13.7
21.8
19.3
1.2
1.0
17.5
16.7
2.1
1.7
Larsen & Toubro
Neutral
1,217
-
170,390
95,787
109,476
10.2
11.6
44.5
50.8
27.4
24.0
3.4
3.2
12.9
13.1
2.3
2.1
Gujarat Pipavav Port
Neutral
134
-
6,500
739
842
61.6
62.7
5.1
6.2
26.4
21.9
3.3
3.2
12.7
14.9
8.3
7.1
PNC Infratech
Neutral
190
-
4,885
2,040
2,935
13.0
13.0
6.4
9.0
29.8
21.2
0.8
0.7
9.7
12.2
2.4
1.7
Simplex Infra
Neutral
517
-
2,556
6,012
6,619
11.6
11.7
21.1
31.0
24.6
16.7
1.7
1.6
6.5
8.6
1.0
0.9
Sadbhav Engineering
Neutral
314
-
5,395
3,823
4,426
10.7
10.8
10.3
11.8
30.5
26.7
3.7
3.2
10.1
10.5
1.7
1.5
NBCC
Neutral
277
-
24,917
9,099
12,706
6.4
6.4
7.3
9.6
38.0
28.9
1.7
1.3
27.5
30.5
2.6
1.9
MEP Infra
Neutral
113
-
1,830
2,403
2,910
18.3
16.8
2.4
6.1
47.9
18.5
18.2
12.2
35.2
55.8
1.9
1.6
SIPL
Neutral
124
-
4,352
2,060
2,390
46.8
47.7
(5.8)
(3.1)
4.6
5.3
(14.2)
(2.3)
6.9
6.4
Engineers India
Neutral
190
-
12,831
1,795
2,611
21.1
22.4
5.9
8.1
32.3
23.5
2.3
2.2
12.9
16.1
5.5
3.6
Financials
Axis Bank
Accumulate
541
580
129,639
32,558
35,843
3.5
3.2
27.8
41.0
19.4
13.2
2.1
1.9
11.4
14.9
-
-
Bank of Baroda
Neutral
165
-
38,088
22,533
26,079
2.4
2.4
12.0
20.9
13.8
7.9
0.9
0.9
6.6
11.0
-
-
Canara Bank
Neutral
389
-
23,253
17,925
20,235
2.0
2.1
18.5
36.5
21.0
10.7
0.8
0.8
3.4
6.2
-
-
Can Fin Homes
Neutral
460
-
6,121
586
741
3.5
3.5
107.8
141.0
4.3
3.3
0.9
0.8
24.1
25.6
-
-
Cholamandalam Inv. &
Neutral
1,264
-
19,756
2,826
3,307
6.3
6.3
53.7
64.6
23.6
19.6
4.0
3.4
18.3
18.9
-
-
Fin. Co.
Dewan Housing Finance Accumulate
633
712
19,851
2,676
3,383
2.4
2.7
37.4
49.7
16.9
12.7
2.2
1.9
13.8
16.2
-
-
Equitas Holdings
Buy
139
235
4,722
1,125
1,380
9.6
9.8
1.5
6.0
92.7
23.2
2.1
2.0
2.4
8.2
-
-
Federal Bank
Accumulate
115
125
22,407
4,896
5,930
2.8
3.1
5.4
7.6
21.3
15.1
1.8
1.7
8.5
11.0
-
-
Stock Watch
November 10, 2017
Company Name
Reco
CMP
Target
Mkt Cap
Sales ( Čcr )
OPM(%)
EPS (Č)
PER(x)
P/BV(x)
RoE(%)
EV/Sales(x)
(Č)
Price ( Č)
( Č cr )
FY18E FY19E
FY18E
FY19E
FY18E
FY19E
FY18E
FY19E
FY18E
FY19E
FY18E
FY19E
FY18E
FY19E
Financials
GIC Housing
Buy
440
655
2,368
376
477
3.6
3.7
33.0
40.0
13.3
11.0
2.4
2.0
20.0
23.0
-
-
HDFC Bank
Neutral
1,826
-
472,317
55,236
63,253
4.5
4.4
68.9
82.4
26.5
22.2
4.6
3.8
18.7
18.5
-
-
ICICI Bank
Neutral
312
-
199,978
42,361
51,378
3.6
3.9
18.4
25.7
17.0
12.1
1.9
1.8
11.3
15.0
-
-
Karur Vysya Bank
Buy
125
180
7,551
3,289
3,630
3.7
3.9
10.8
14.1
11.5
8.9
1.4
1.2
12.5
14.7
-
-
LIC Housing Finance
Accumulate
583
630
29,412
4,895
6,332
3.4
3.7
50.7
66.8
11.5
8.7
2.3
1.9
21.7
23.8
-
-
Punjab Natl.Bank
Neutral
192
-
40,878
23,708
25,758
2.1
2.1
5.9
16.4
32.7
11.7
1.0
0.9
3.0
8.3
-
-
RBL Bank
Neutral
510
-
21,235
2,309
2,888
2.6
2.5
16.4
19.1
31.2
26.8
3.9
3.5
13.3
13.8
-
-
Repco Home Finance
Buy
568
825
3,554
496
597
4.4
4.2
38.5
48.7
14.8
11.7
2.7
2.2
19.6
20.6
-
-
South Ind.Bank
Neutral
31
-
5,539
3,195
3,567
3.0
3.1
3.0
3.8
10.2
8.0
1.0
0.9
10.5
11.9
-
-
St Bk of India
Neutral
314
-
270,831
105,827
121,056
2.4
2.5
16.1
25.6
19.5
12.3
1.5
1.4
6.6
9.9
-
-
Union Bank
Neutral
166
-
12,088
14,650
16,225
2.3
2.3
23.1
32.5
7.2
5.1
0.6
0.5
7.1
9.2
-
-
Yes Bank
Neutral
305
-
69,798
11,088
13,138
3.0
2.9
84.0
99.3
3.6
3.1
0.6
0.5
16.3
16.8
-
-
FMCG
Akzo Nobel India
Neutral
1,818
-
8,717
3,164
3,607
13.8
13.7
58.6
67.9
31.0
26.8
7.6
6.7
24.5
25.1
2.6
2.3
Asian Paints
Neutral
1,195
-
114,648
17,603
20,615
18.6
18.6
2,128.9
2,543.3
0.6
0.5
11.8
10.0
28.0
28.9
6.3
5.3
Britannia
Neutral
4,759
-
57,131
9,690
11,278
14.8
15.4
84.0
101.0
56.7
47.1
20.6
16.4
40.6
39.0
5.9
5.0
Colgate
Neutral
1,039
-
28,261
4,420
5,074
24.9
25.3
28.6
32.8
36.3
31.7
14.3
11.6
43.8
40.5
6.1
5.3
Dabur India
Neutral
348
-
61,266
8,346
9,344
19.6
19.9
7.8
9.0
44.6
38.6
9.0
8.1
25.2
24.8
6.9
6.1
GlaxoSmith Con*
Neutral
5,936
-
24,965
5,072
5,760
18.2
18.4
176.3
199.2
33.7
29.8
7.1
6.5
21.2
21.7
4.2
3.7
Godrej Consumer
Neutral
977
-
66,532
10,171
11,682
20.8
21.5
21.7
27.1
45.0
36.0
10.1
8.7
22.3
23.4
6.7
5.7
HUL
Neutral
1,253
-
271,274
37,077
41,508
20.3
21.8
5,189.9
6,318.5
0.2
0.2
38.2
32.6
74.8
82.0
7.2
6.4
ITC
Neutral
260
-
316,945
44,588
49,853
37.0
37.3
9.6
11.0
27.1
23.7
6.7
6.3
25.1
27.3
6.6
5.9
Marico
Neutral
314
-
40,485
6,788
7,766
18.5
19.2
7.1
8.5
44.2
36.9
15.5
13.2
36.9
38.0
5.8
5.1
Nestle*
Neutral
7,793
-
75,137
10,083
11,182
20.0
20.9
119.7
141.3
65.1
55.2
229.5
209.7
36.7
39.8
7.1
6.4
Tata Global
Neutral
240
-
15,176
7,121
7,641
11.9
12.3
6.9
8.0
34.9
30.1
2.3
2.2
6.8
7.2
1.9
1.8
Procter & Gamble
Neutral
8,823
-
28,640
3,034
3,579
27.1
27.7
167.7
198.8
52.6
44.4
14.1
12.2
28.8
29.5
8.9
7.4
Hygiene
IT
HCL Tech^
Buy
877
1,014
125,204
50,009
54,608
22.1
22.1
62.8
67.6
14.0
13.0
3.1
2.7
22.4
20.6
2.2
1.9
Infosys
Buy
955
1,120
219,271
70,333
75,960
26.0
26.0
61.7
65.9
15.5
14.5
2.9
2.7
18.9
18.7
2.5
2.3
TCS
Neutral
2,734
-
538,685
123,384
134,488
26.1
26.1
133.2
143.7
20.5
19.0
5.7
5.3
27.6
27.8
4.0
3.6
Tech Mahindra
Accumulate
489
533
47,789
31,015
33,496
15.0
15.0
35.6
38.1
13.8
12.9
2.3
2.2
17.0
16.3
1.3
1.1
Stock Watch
November 10, 2017
Company Name
Reco
CMP
Target
Mkt Cap
Sales ( Čcr )
OPM(%)
EPS (Č)
PER(x)
P/BV(x)
RoE(%)
EV/Sales(x)
(Č)
Price ( Č)
( Č cr )
FY18E FY19E
FY18E
FY19E
FY18E
FY19E
FY18E
FY19E
FY18E
FY19E
FY18E
FY19E
FY18E
FY19E
IT
Wipro
Neutral
303
-
147,266
54,164
56,544
22.3
22.3
18.8
19.5
16.1
15.5
2.6
2.2
15.0
13.6
1.9
1.7
Media
D B Corp
Neutral
367
-
6,750
2,404
2,625
30.5
31.5
23.7
26.9
15.5
13.6
3.6
3.1
23.5
22.8
2.7
2.4
HT Media
Neutral
99
-
2,304
2,589
2,830
15.1
15.4
8.3
10.9
11.9
9.1
1.0
0.9
8.4
10.4
0.4
0.3
Jagran Prakashan
Buy
173
225
5,643
2,541
2,835
28.5
28.7
12.7
14.1
13.6
12.2
2.8
2.4
21.3
21.4
2.1
1.8
Sun TV Network
Neutral
881
-
34,707
3,238
3,789
51.9
55.1
30.9
38.0
28.5
23.2
8.1
7.1
30.0
31.0
10.2
8.6
Hindustan Media
Neutral
240
-
1,761
1,002
1,074
23.3
23.5
29.2
33.8
8.2
7.1
1.3
1.1
15.6
15.4
0.8
0.5
Ventures
TV Today Network
Buy
369
435
2,198
667
727
27.7
27.7
18.6
20.1
19.8
18.4
3.1
3.2
15.6
17.3
2.8
2.6
Music Broadcast Limited Buy
377
434
2,150
271
317
91.0
109.0
6.0
10.0
62.8
37.7
3.9
3.6
6.5
9.3
7.5
6.2
Metals & Mining
Coal India
Neutral
283
-
175,732
82,301
91,235
17.0
18.0
17.1
20.5
16.6
13.8
3.1
2.9
45.0
55.0
1.8
1.6
Hind. Zinc
Neutral
314
-
132,781
22,108
24,555
57.0
58.0
22.1
26.3
14.2
12.0
4.6
3.7
32.0
35.0
5.0
4.2
Hindalco
Neutral
264
-
59,149
102,350
105,355
13.5
14.5
21.5
24.5
12.3
10.8
1.7
1.4
15.0
15.2
1.2
1.1
JSW Steel
Neutral
264
-
63,778
64,500
68,245
21.1
21.5
20.1
21.2
13.1
12.5
2.4
2.1
-
-
1.7
1.6
NMDC
Neutral
126
-
39,833
10,209
11,450
47.0
48.0
11.1
12.1
11.3
10.4
1.6
1.5
-
-
3.4
3.1
SAIL
Neutral
78
-
32,277
54,100
63,555
3.0
10.0
(10.0)
1.5
52.1
1.0
1.0
-
-
1.6
1.4
Vedanta
Neutral
324
-
120,344
81,206
87,345
28.0
29.0
26.5
33.5
12.2
9.7
2.8
2.4
-
-
2.2
1.9
Tata Steel
Neutral
703
-
68,306
121,445
126,500
16.2
17.2
65.4
81.3
10.8
8.7
1.7
1.5
-
-
1.1
1.0
Oil & Gas
GAIL
Neutral
450
-
76,159
53,115
52,344
14.2
15.3
30.0
31.1
15.0
14.5
1.9
1.7
-
-
1.2
1.1
ONGC
Neutral
190
-
243,190
83,111
84,934
44.2
44.9
16.4
16.9
11.6
11.2
1.4
1.3
-
-
2.8
2.8
Indian Oil Corp
Neutral
395
-
191,614
396,116
432,560
8.5
8.8
40.1
42.2
9.8
9.4
1.7
1.5
-
-
0.6
0.6
Reliance Industries
Neutral
902
-
586,350
257,711
267,438
17.0
18.2
89.1
89.5
10.1
10.1
0.9
0.9
-
-
1.9
1.8
Pharmaceuticals
Alembic Pharma
Buy
514
600
9,694
3,903
4,584
18.2
19.2
21.8
27.2
23.6
18.9
4.3
3.6
19.8
20.6
2.5
2.1
Alkem Laboratories Ltd
Accumulate
1,943
2,125
23,233
6,320
7,341
17.5
19.8
72.7
96.6
26.7
20.1
4.7
4.0
16.7
18.7
3.6
3.0
Aurobindo Pharma
Neutral
789
-
46,238
17,086
19,478
22.1
22.0
44.7
51.4
17.7
15.4
3.9
3.2
24.7
22.7
2.8
2.5
Aventis*
Neutral
4,406
-
10,147
2,508
2,862
16.8
16.8
139.9
153.8
31.5
28.7
4.6
3.7
23.5
25.8
3.7
3.0
Cadila Healthcare
Reduce
479
426
49,001
11,584
13,228
20.3
20.4
18.7
21.3
25.6
22.5
5.7
4.7
24.6
22.9
4.1
3.5
Cipla
Sell
614
458
49,424
16,619
19,437
15.4
16.2
19.7
24.3
31.2
25.3
3.6
3.2
12.0
13.2
3.1
2.7
Dr Reddy's
Neutral
2,368
-
39,263
15,844
17,973
17.6
18.2
91.7
111.0
25.8
21.3
2.9
2.7
11.9
13.0
2.7
2.4
GSK Pharma*
Neutral
2,626
-
22,240
3,260
3,651
15.0
18.0
46.1
58.6
57.0
44.8
11.7
12.1
20.0
26.5
6.7
6.1
Indoco Remedies
Sell
257
153
2,366
1,154
1,310
14.9
14.9
11.3
12.7
22.7
20.2
3.2
2.9
15.0
15.0
2.2
1.9
Stock Watch
November 10, 2017
Company Name
Reco
CMP
Target
Mkt Cap
Sales ( Čcr )
OPM(%)
EPS (Č)
PER(x)
P/BV(x)
RoE(%)
EV/Sales(x)
(Č)
Price ( Č)
( Č cr )
FY18E FY19E
FY18E
FY19E
FY18E
FY19E
FY18E
FY19E
FY18E
FY19E
FY18E
FY19E
FY18E
FY19E
Pharmaceuticals
Ipca labs
Neutral
547
-
6,903
3,593
4,022
14.5
15.5
19.4
25.2
28.2
21.7
2.6
2.3
9.5
11.2
2.0
1.8
Lupin
Buy
832
1,467
37,601
18,657
21,289
21.3
23.3
52.8
66.7
15.8
12.5
2.4
2.0
16.3
17.5
2.0
1.7
Natco Pharma
Buy
912
1,057
15,894
1,886
2,016
32.3
29.5
23.2
22.0
39.4
41.4
8.2
7.3
20.9
17.6
8.3
7.7
Sun Pharma
Neutral
535
-
128,336
32,899
36,451
26.9
25.4
31.6
32.3
16.9
16.6
3.0
2.6
18.7
18.8
3.5
3.0
Syngene International
Accumulate
504
556
10,077
1,394
1,818
33.0
36.0
15.8
20.6
31.8
24.5
5.9
4.9
18.6
20.0
7.2
5.5
Power
Tata Power
Neutral
84
-
22,652
32,547
33,806
20.5
20.5
4.7
5.4
17.8
15.7
1.7
1.5
10.5
10.5
1.7
1.6
NTPC
Neutral
178
-
146,522
86,070
101,246
28.3
30.7
12.9
16.2
13.8
11.0
1.4
1.3
10.6
12.4
3.1
2.7
Power Grid
Accumulate
208
223
108,843
29,183
32,946
89.7
90.0
18.0
20.8
11.6
10.0
1.9
1.7
17.7
18.2
7.7
7.1
Real Estate
Prestige Estate
Neutral
281
-
10,528
4,607
5,146
21.0
22.2
7.9
9.8
35.5
28.7
2.2
2.0
10.3
12.0
3.5
3.1
MLIFE
Buy
431
522
2,210
487
590
12.3
17.8
21.0
31.2
20.5
13.8
1.1
1.0
5.2
7.4
3.3
2.7
Telecom
Bharti Airtel
Neutral
504
-
201,429
97,903
105,233
36.0
36.3
9.3
11.1
54.2
45.6
2.6
2.5
5.0
5.6
3.0
2.7
Idea Cellular
Neutral
97
-
34,864
35,012
37,689
27.1
27.7
(4.4)
(2.7)
1.5
1.6
(6.8)
(4.6)
2.3
2.1
zOthers
Abbott India
Neutral
4,473
-
9,506
3,244
3,723
14.9
16.1
167.5
209.4
26.7
21.4
5.9
4.9
23.7
24.8
2.6
2.2
Asian Granito
Buy
494
570
1,486
1,169
1,286
12.5
12.5
16.0
19.7
30.9
25.1
3.3
2.9
10.7
11.6
1.5
1.3
Bajaj Electricals
Neutral
384
-
3,907
4,646
5,301
6.7
7.6
16.1
22.3
23.9
17.2
3.9
3.3
16.4
19.2
0.8
0.7
Banco Products (India)
Neutral
221
-
1,581
1,530
1,695
13.2
12.7
19.0
20.0
11.6
11.1
1.9
1.6
0.2
0.2
0.9
104.8
Coffee Day Enterprises
Neutral
248
-
5,099
3,494
3,913
17.4
18.0
4.8
5.7
-
43.4
2.2
2.1
-
0.1
1.9
1.7
Ltd
Elecon Engineering
Neutral
74
-
834
171
201
15.0
16.2
36.0
43.0
2.1
1.7
0.2
0.2
0.1
0.1
4.2
3.6
Garware Wall Ropes
Neutral
900
-
1,969
928
1,003
15.2
15.2
39.4
43.2
22.8
20.9
3.8
3.2
16.5
15.4
2.0
1.8
Goodyear India*
Neutral
802
-
1,849
1,717
1,866
11.8
12.3
47.9
49.8
16.7
16.1
2.6
2.2
15.6
15.7
0.8
110.5
Hitachi
Neutral
2,387
-
6,490
2,355
2,715
10.3
10.8
49.0
60.9
48.7
39.2
11.4
9.0
0.2
0.2
2.8
2.4
HSIL
Neutral
468
-
3,381
2,240
2,670
14.6
15.0
17.0
22.0
27.5
21.3
2.3
2.1
0.1
0.1
1.7
1.4
Interglobe Aviation
Neutral
1,197
-
43,310
22,570
27,955
14.2
15.0
63.6
81.8
18.8
14.7
9.9
8.4
0.5
0.6
1.6
1.2
Jyothy Laboratories
Neutral
346
-
6,286
1,781
2,044
14.1
15.0
9.4
10.5
37.0
32.9
7.9
7.4
0.2
0.2
3.8
3.2
Linc Pen & Plastics
Neutral
242
-
358
420
462
9.3
9.3
15.3
17.1
15.9
14.2
2.7
2.8
16.9
19.5
0.9
0.8
M M Forgings
Neutral
835
-
1,008
542
642
20.1
21.0
41.6
56.8
20.1
14.7
2.8
2.3
0.1
0.2
2.3
2.0
Mirza International
Neutral
165
-
1,990
1,148
1,285
18.0
18.0
8.0
9.4
20.6
17.7
3.4
2.9
16.3
16.1
1.9
1.7
Navkar Corporation
Buy
189
265
2,697
561
617
41.5
41.5
11.5
12.7
16.4
14.9
1.7
1.6
10.5
10.4
5.5
4.8
Nilkamal
Neutral
1,620
-
2,418
2,317
2,525
11.4
11.1
96.0
105.0
16.9
15.4
2.9
2.5
0.2
0.2
1.0
0.9
Stock Watch
November 10, 2017
Company Name
Reco
CMP
Target Mkt Cap
Sales ( Čcr )
OPM(%)
EPS (Č)
PER(x)
P/BV(x)
RoE(%)
EV/Sales(x)
(Č)
Price ( Č)
( Č cr )
FY18E FY19E FY18E FY19E FY18E FY19E FY18E FY19E FY18E FY19E FY18E FY19E FY18E FY19E
zOthers
Parag Milk Foods
Neutral
254
-
2,140
1,987
2,379
7.6
9.0
12.4
18.3
20.5
13.9
2.9
2.5
8.2
13.2
1.2
1.0
Radico Khaitan
Neutral
213
-
2,831
1,811
1,992
13.2
13.2
8.1
8.8
26.2
24.1
2.7
2.9
10.1
12.0
1.9
1.7
Relaxo Footwears
Neutral
574
-
6,895
1,981
2,310
13.7
14.5
12.0
15.5
47.8
37.0
9.3
7.5
0.2
0.2
3.5
3.0
Siyaram Silk Mills
Accumulate
599
650
2,809
1,769
1,981
12.7
12.7
22.6
26.2
26.5
22.9
4.1
3.5
15.5
15.5
1.8
1.6
Styrolution ABS India* Neutral
958
-
1,685
1,800
1,980
8.0
8.1
42.0
46.2
22.8
20.7
2.6
2.3
0.1
0.1
1.1
1.0
Surya Roshni
Neutral
366
-
1,603
4,870
5,320
7.7
7.8
22.8
28.1
16.1
13.0
2.1
1.8
0.1
0.1
0.6
0.5
TVS Srichakra
Neutral
3,015
-
2,309
2,729
2,893
12.7
12.5
248.5
265.0
12.1
11.4
3.4
2.8
0.3
0.3
0.8
0.8
Visaka Industries
Neutral
668
-
1,061
1,104
1,214
12.1
12.6
31.0
37.9
21.6
17.7
2.6
2.4
0.1
0.1
1.2
1.1
VIP Industries
Neutral
303
-
4,279
1,450
1,693
10.4
10.5
6.5
7.8
46.3
38.8
9.8
8.6
21.1
22.1
2.9
2.5
Navin Fluorine
Neutral
705
-
3,476
945
1,154
22.4
22.6
28.7
34.8
24.6
20.3
4.1
3.5
-
-
3.2
2.5
Source: Company, Angel Research; Note: *December year end; #September year end; &October year end; Price as on November 09, 2017
Market Outlook
November 10, 2017
Research Team Tel: 022 - 39357800
DISCLAIMER
Angel Broking Private Limited (hereinafter referred to as “Angel”) is a registered Member of National Stock Exchange of India
Limited,Bombay Stock Exchange Limited and Metropolitan Stock Exchange Limited. It is also registered as a Depository Participant with
CDSL and Portfolio Manager with SEBI. It also has registration with AMFI as a Mutual Fund Distributor. Angel Broking Private Limited is a
registered entity with SEBI for Research Analyst in terms of SEBI (Research Analyst) Regulations, 2014 vide registration number
INH000000164. Angel or its associates has not been debarred/ suspended by SEBI or any other regulatory authority for accessing
/dealing in securities Market. Angel or its associates/analyst has not received any compensation / managed or
co-managed public offering of securities of the company covered by Analyst during the past twelve months.
This document is solely for the personal information of the recipient, and must not be singularly used as the basis of any investment
decision. Nothing in this document should be construed as investment or financial advice. Each recipient of this document should make
such investigations as they deem necessary to arrive at an independent evaluation of an investment in the securities of the companies
referred to in this document (including the merits and risks involved), and should consult their own advisors to determine the merits and
risks of such an investment.
Reports based on technical and derivative analysis center on studying charts of a stock's price movement, outstanding positions and
trading volume, as opposed to focusing on a company's fundamentals and, as such, may not match with a report on a company's
fundamentals. Investors are advised to refer the Fundamental and Technical Research Reports available on our website to evaluate the
contrary view, if any.
The information in this document has been printed on the basis of publicly available information, internal data and other reliable
sources believed to be true, but we do not represent that it is accurate or complete and it should not be relied on as such, as this
document is for general guidance only. Angel Broking Pvt. Limited or any of its affiliates/ group companies shall not be in any way
responsible for any loss or damage that may arise to any person from any inadvertent error in the information contained in this report.
Angel Broking Pvt. Limited has not independently verified all the information contained within this document. Accordingly, we cannot
testify, nor make any representation or warranty, express or implied, to the accuracy, contents or data contained within this document.
While Angel Broking Pvt. Limited endeavors to update on a reasonable basis the information discussed in this material, there may be
regulatory, compliance, or other reasons that prevent us from doing so.
This document is being supplied to you solely for your information, and its contents, information or data may not be reproduced,
redistributed or passed on, directly or indirectly.
Neither Angel Broking Pvt. Limited, nor its directors, employees or affiliates shall be liable for any loss or damage that may arise from
or in connection with the use of this information.